
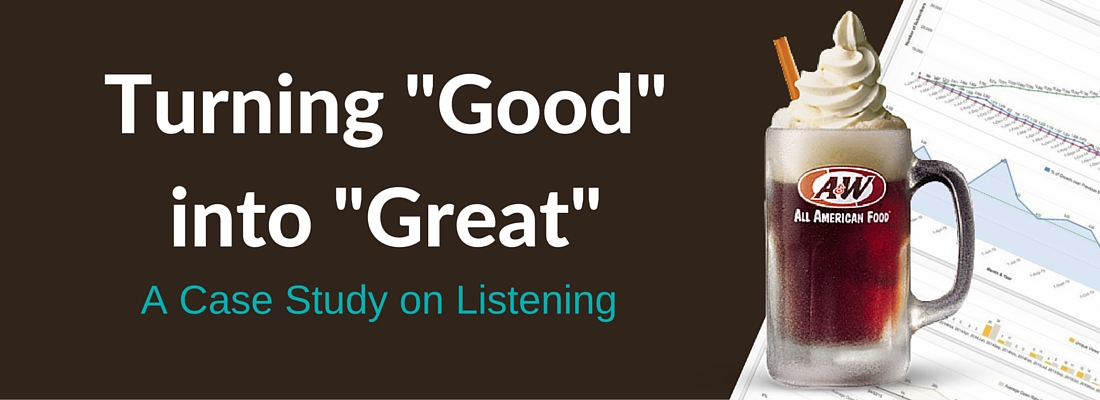
A&W Restaurants ® has been an American icon since 1919 serving up frosty Root Beer Floats, infamous Coney Dogs and more. This original post from just over a year ago examines their subscriber engagement metrics for their email marketing program over time.
Understand Subscriber Engagement:
When A&W began their email marketing program,they wanted to take a deep dive into their subscriber engagement. Subscribers receive a monthly coupon or special offer along with a free Root Beer Float during their birthday month. Almost always, the monthly campaign includes an intriguing video to support.
RootedELM, A&W and Team Cornett, their agency of record, analyze their email marketing program through a metrics dashboard using Klipfolio. A trend line incorporating data displays an average open rate of 32% and a unique click-through rate of 6%. These metrics may sound pretty good compared to industry standards, however, when broken down by year we found a different story – a decline. More importantly, although we change content each month, acquire and churn subscribers, the average click-to-open rate (CTOR), or sometimes referred to as the “effective rate,” basically remained the same at 18%.
CTOR: unique clicks ÷ unique opens × 100

To identify how many subscribers were unengaged, we ran a report in their Salesforce Marketing Cloud (SFMC) account. Our criteria was the subscriber had to have received a minimum of three emails over the past 90 days, but did not open or click once. This gave us about 44% of our audience — YIKES!
Now let me step back a bit. A&W ONLY obtains subscribers that have opted-in on their website to join the Mug Club and, on average, experience active subscriber growth of 4% each month. So, you can see why this number was a little shocking to us.
Time for a study:
During one month, the unengaged audience received the same monthly Mug Club email as the engaged audience, however each had a unique tracking and analytic code added to study their behavior. We use Litmus for this.
Here’s what we found in SFMC – the engaged audience had a unique open rate of 42% and 6% unique click-through rate and the unengaged audience — a whopping 6% open rate and 1% unique click-through. What a difference.
However, when we went into Litmus their engagement seemed very similar. As shown in the chart below, of the 42% engaged audience that opened the email, 67% spent greater than eight seconds reading the campaign. The majority used a mobile device. The unengaged audience had 72% (of the 6% that opened the campaign) spend greater than eight seconds reading. Even more interesting, we repeated this segmentation & send process over the next three months and found similar results.

What does this tell us?
Those that open the monthly Mug Club email spend time reading, but getting them to convert is a challenge. We can do better with the call-to-action and content. This outcome is also reflective where the average CTOR has remained at 18% for all three years.
Where to go from here?
A&W is taking an active approach to listening to their audience through engagement metrics as well as online surveys to determine interest. As a team, we’re working on an updated plan to nudge those unengaged back to life.